Regional Inequalities and the Cost of Living Crisis

Levelling Up was intended to be a flagship initiative of Boris Johnson's administration. Recent changes in government have resulted in a loss of momentum for this initiative, while inequality within and between regions of the United Kingdom appears to have worsened. Nowhere is this more evident than in the current cost of living crisis affecting the country.
The cost of living crisis has affected us all.
Fuel prices have soared, gas prices have increased dramatically compared to 2021, electricity prices have also risen, inflation is high, and food prices continue to rise. Two pints of milk that previously cost around 90p now cost £1.30. In my household, supermarket prices have increased by about 20%. I can likely absorb this increase, at least for the time being. However, can everyone else?
That's the point: not everyone can. It appears that certain parts of the UK are faring much worse than others. According to a recent report by the Centre for Cities, there is a clear "North-South" divide. The report analyses inflation data for 60 English cities and suggests that regional inequalities are being intensified by the crisis.
Key findings include:
- Inflation rates in northern cities are 30% higher compared to other regions.
- Workers in the North Midlands and Wales are likely to be £340 per annum worse off than those residing in the South.
- Eight out of the ten cities with the highest energy costs are located in the North, Midlands, and Wales.
Top 5% City | Inflation Rate | Bottom 5% City | Inflation Rate |
Burnley | 11.5 | Milton Keynes | 9.6 |
Blackburn | 11.0 | Reading | 9.4 |
Blackpool | 11.0 | Oxford | 9.3 |
Bradford | 10.9 | Cambridge | 8.8 |
Leicester | 10.8 | London | 8.8 |
The research identifies three contributing factors to this disparity.
- Energy Costs: Housing with poor insulation tends to be less energy-efficient, resulting in higher energy costs. The North, Midlands, and Wales have a higher proportion of inefficient housing compared to regions like Milton Keynes. For instance, in Burnley, 75% of housing is rated below band C for energy efficiency, while the corresponding figure for Milton Keynes is 50%. Average energy bills in Burnley are £400 per annum higher than in Milton Keynes. This pattern is replicated across England and Wales. When regional wage differentials are considered, households in the North are more likely to experience fuel poverty than those in the South.
- Reliance on Cars: Research indicates that towns and cities with lower availability of public transport, such as Burnley and Blackburn, have a higher reliance on car commuting over longer distances (which also applies to many rural areas like North Devon). Households in these regions are more susceptible to increases in petrol and diesel prices than those in the South.
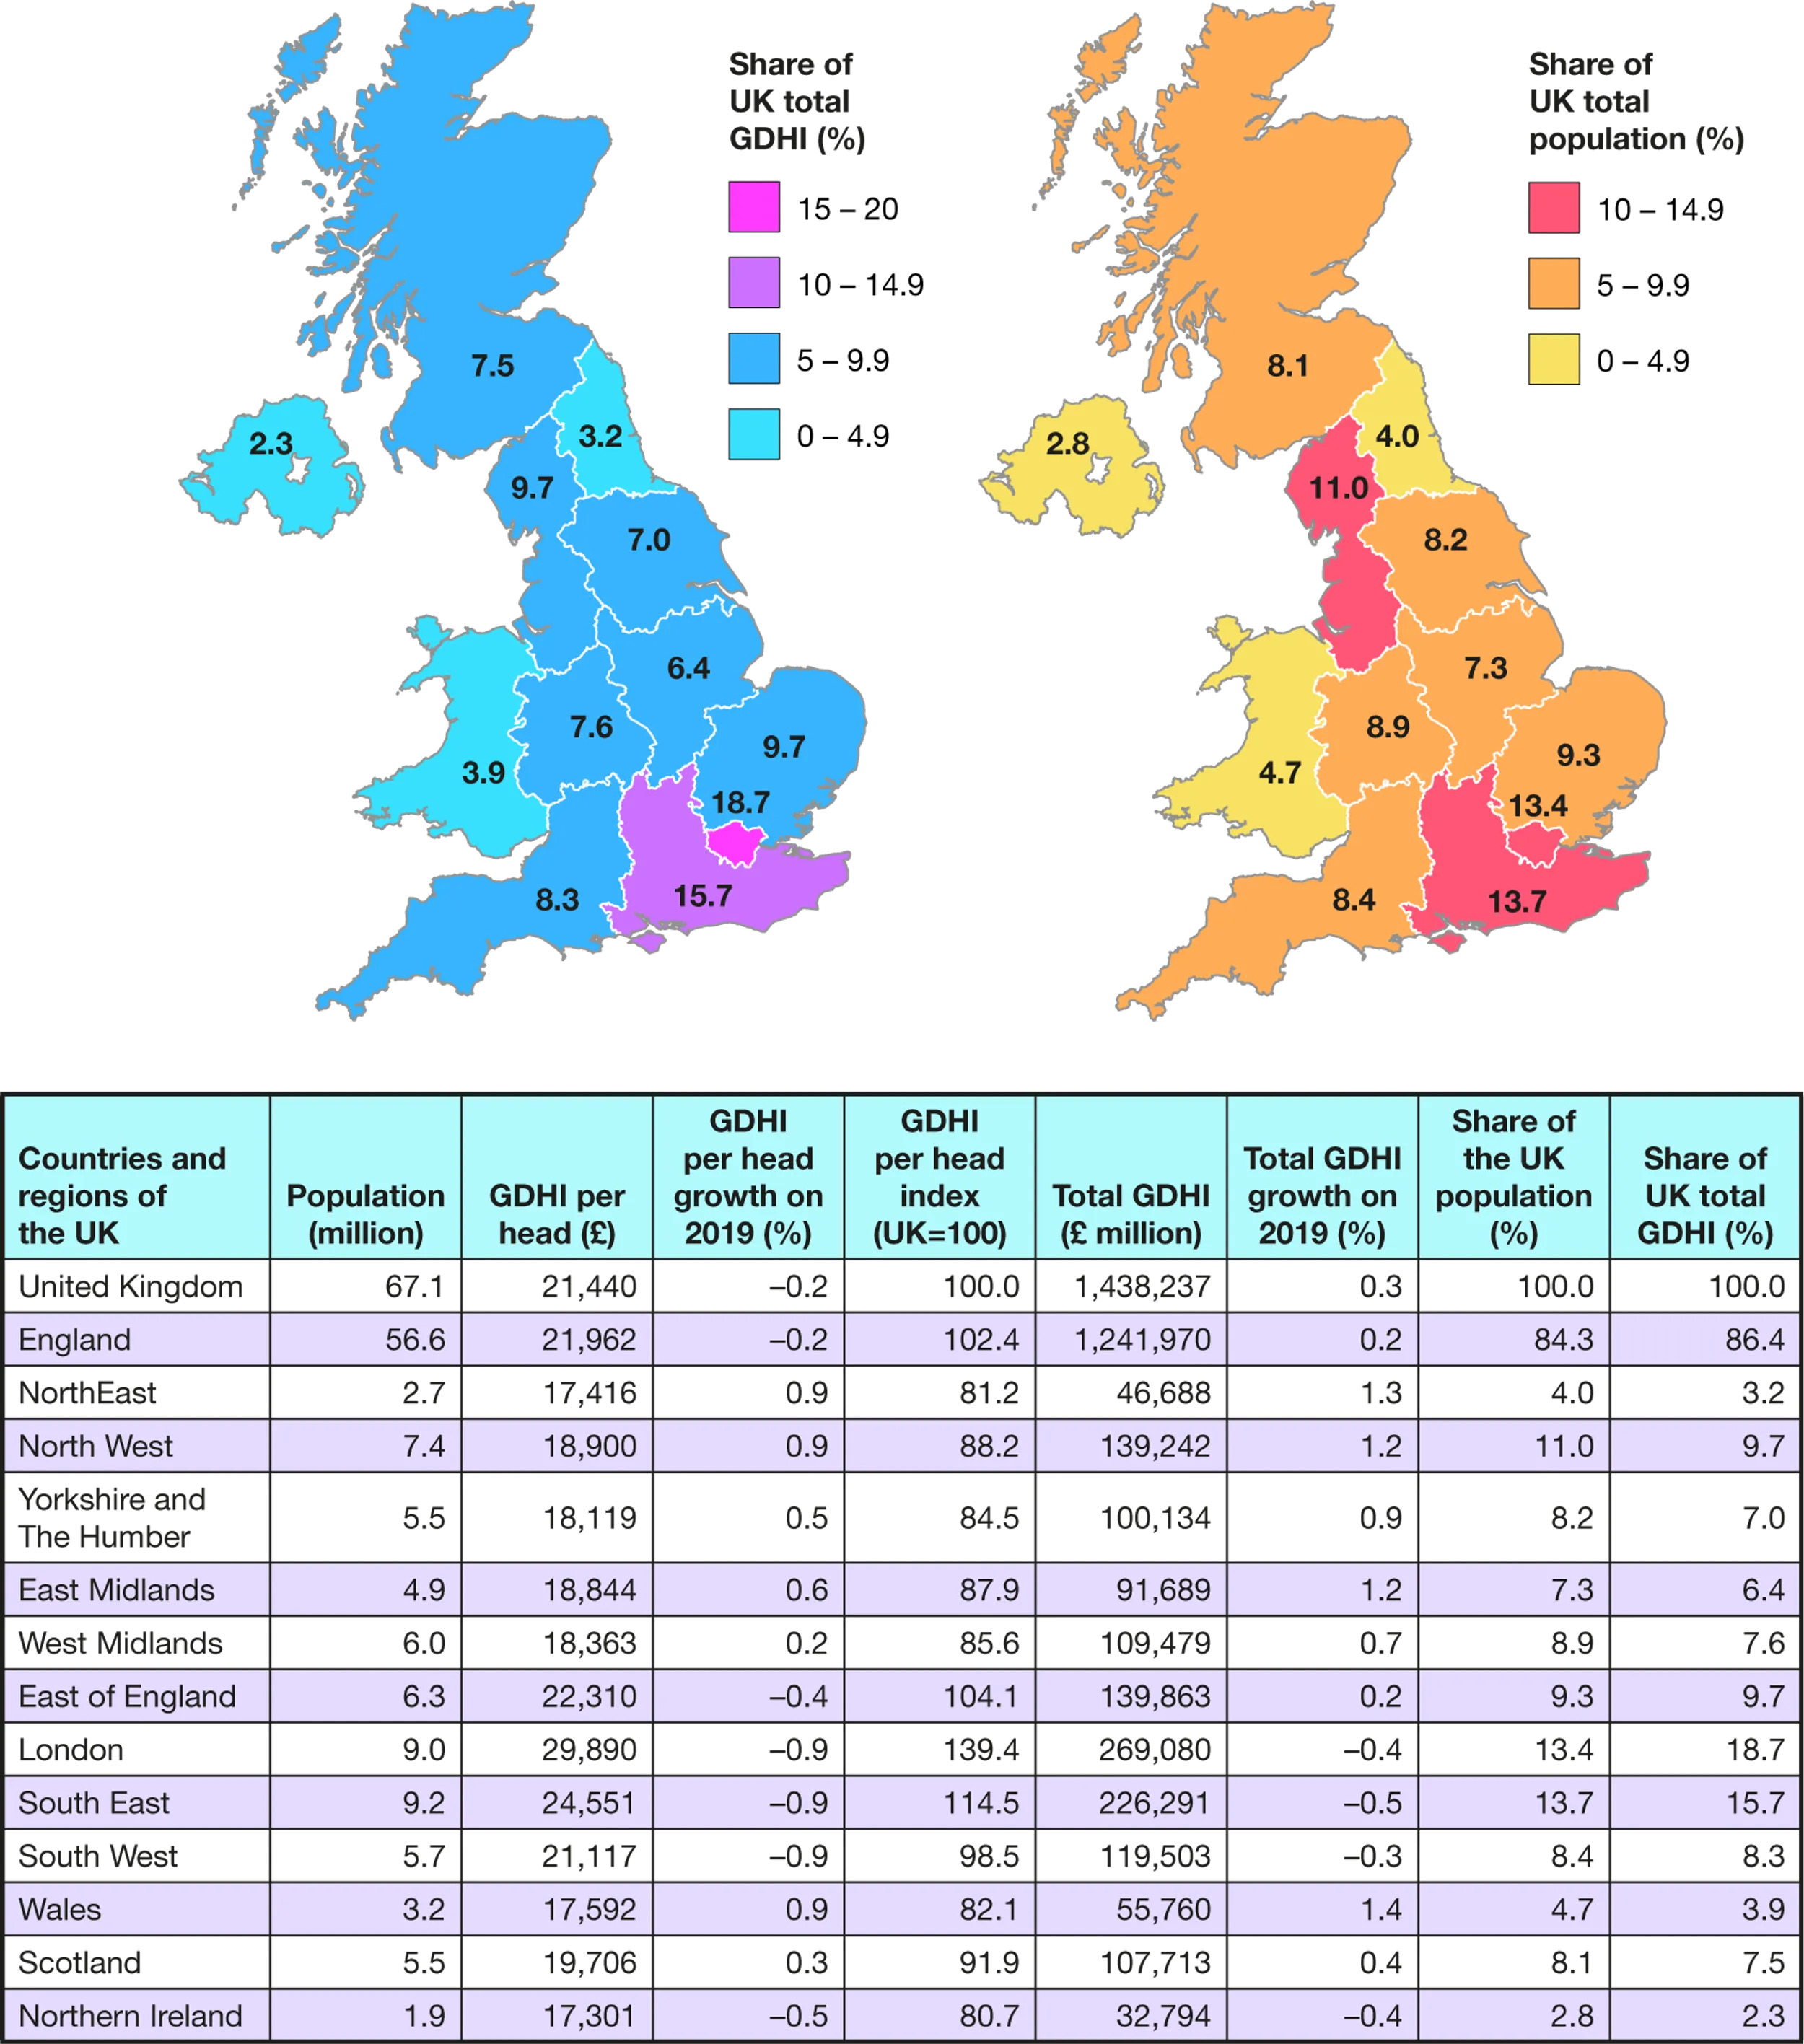
- Income Levels: Evidence suggests that the UK exhibits the highest level of regional inequality among large wealthy countries worldwide. The distribution of household disposable income in the UK demonstrates that households in the North, Midlands, and Wales have considerably lower disposable income compared to the South.
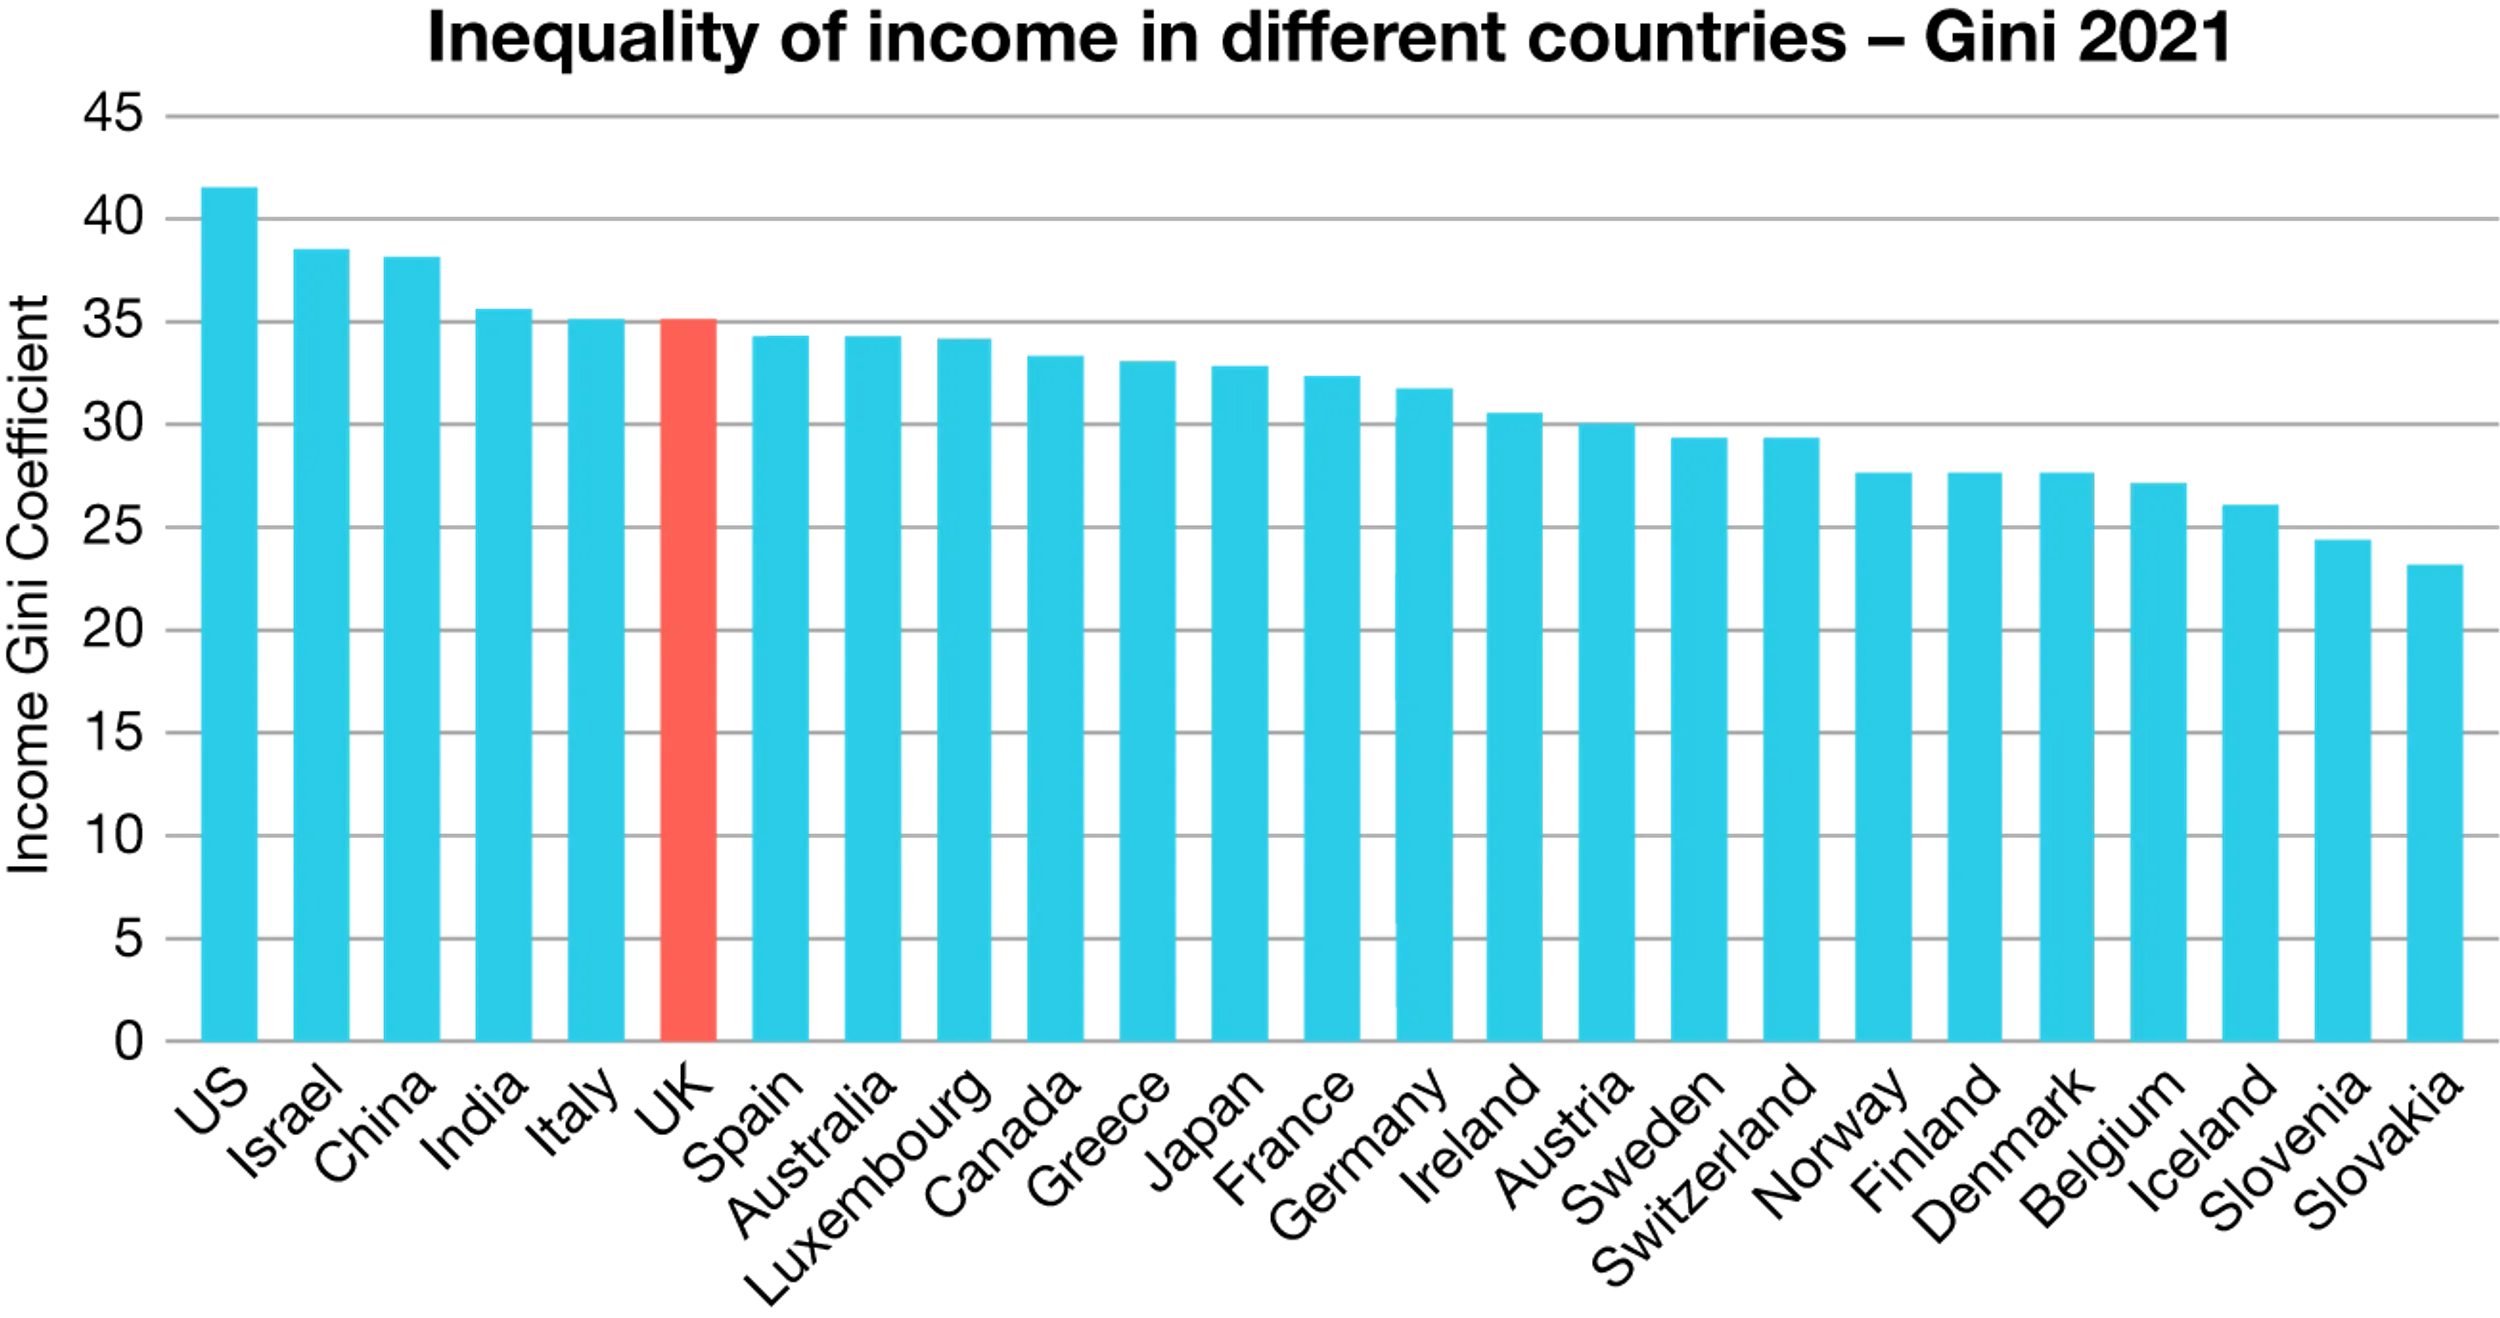
In comparison to other developed nations, the UK exhibits a high unequal income distribution, reflected by its Gini coefficient of 0.351. Within Europe, the UK ranks among the countries with the highest levels of income inequality, although it is comparatively less unequal than the United States.
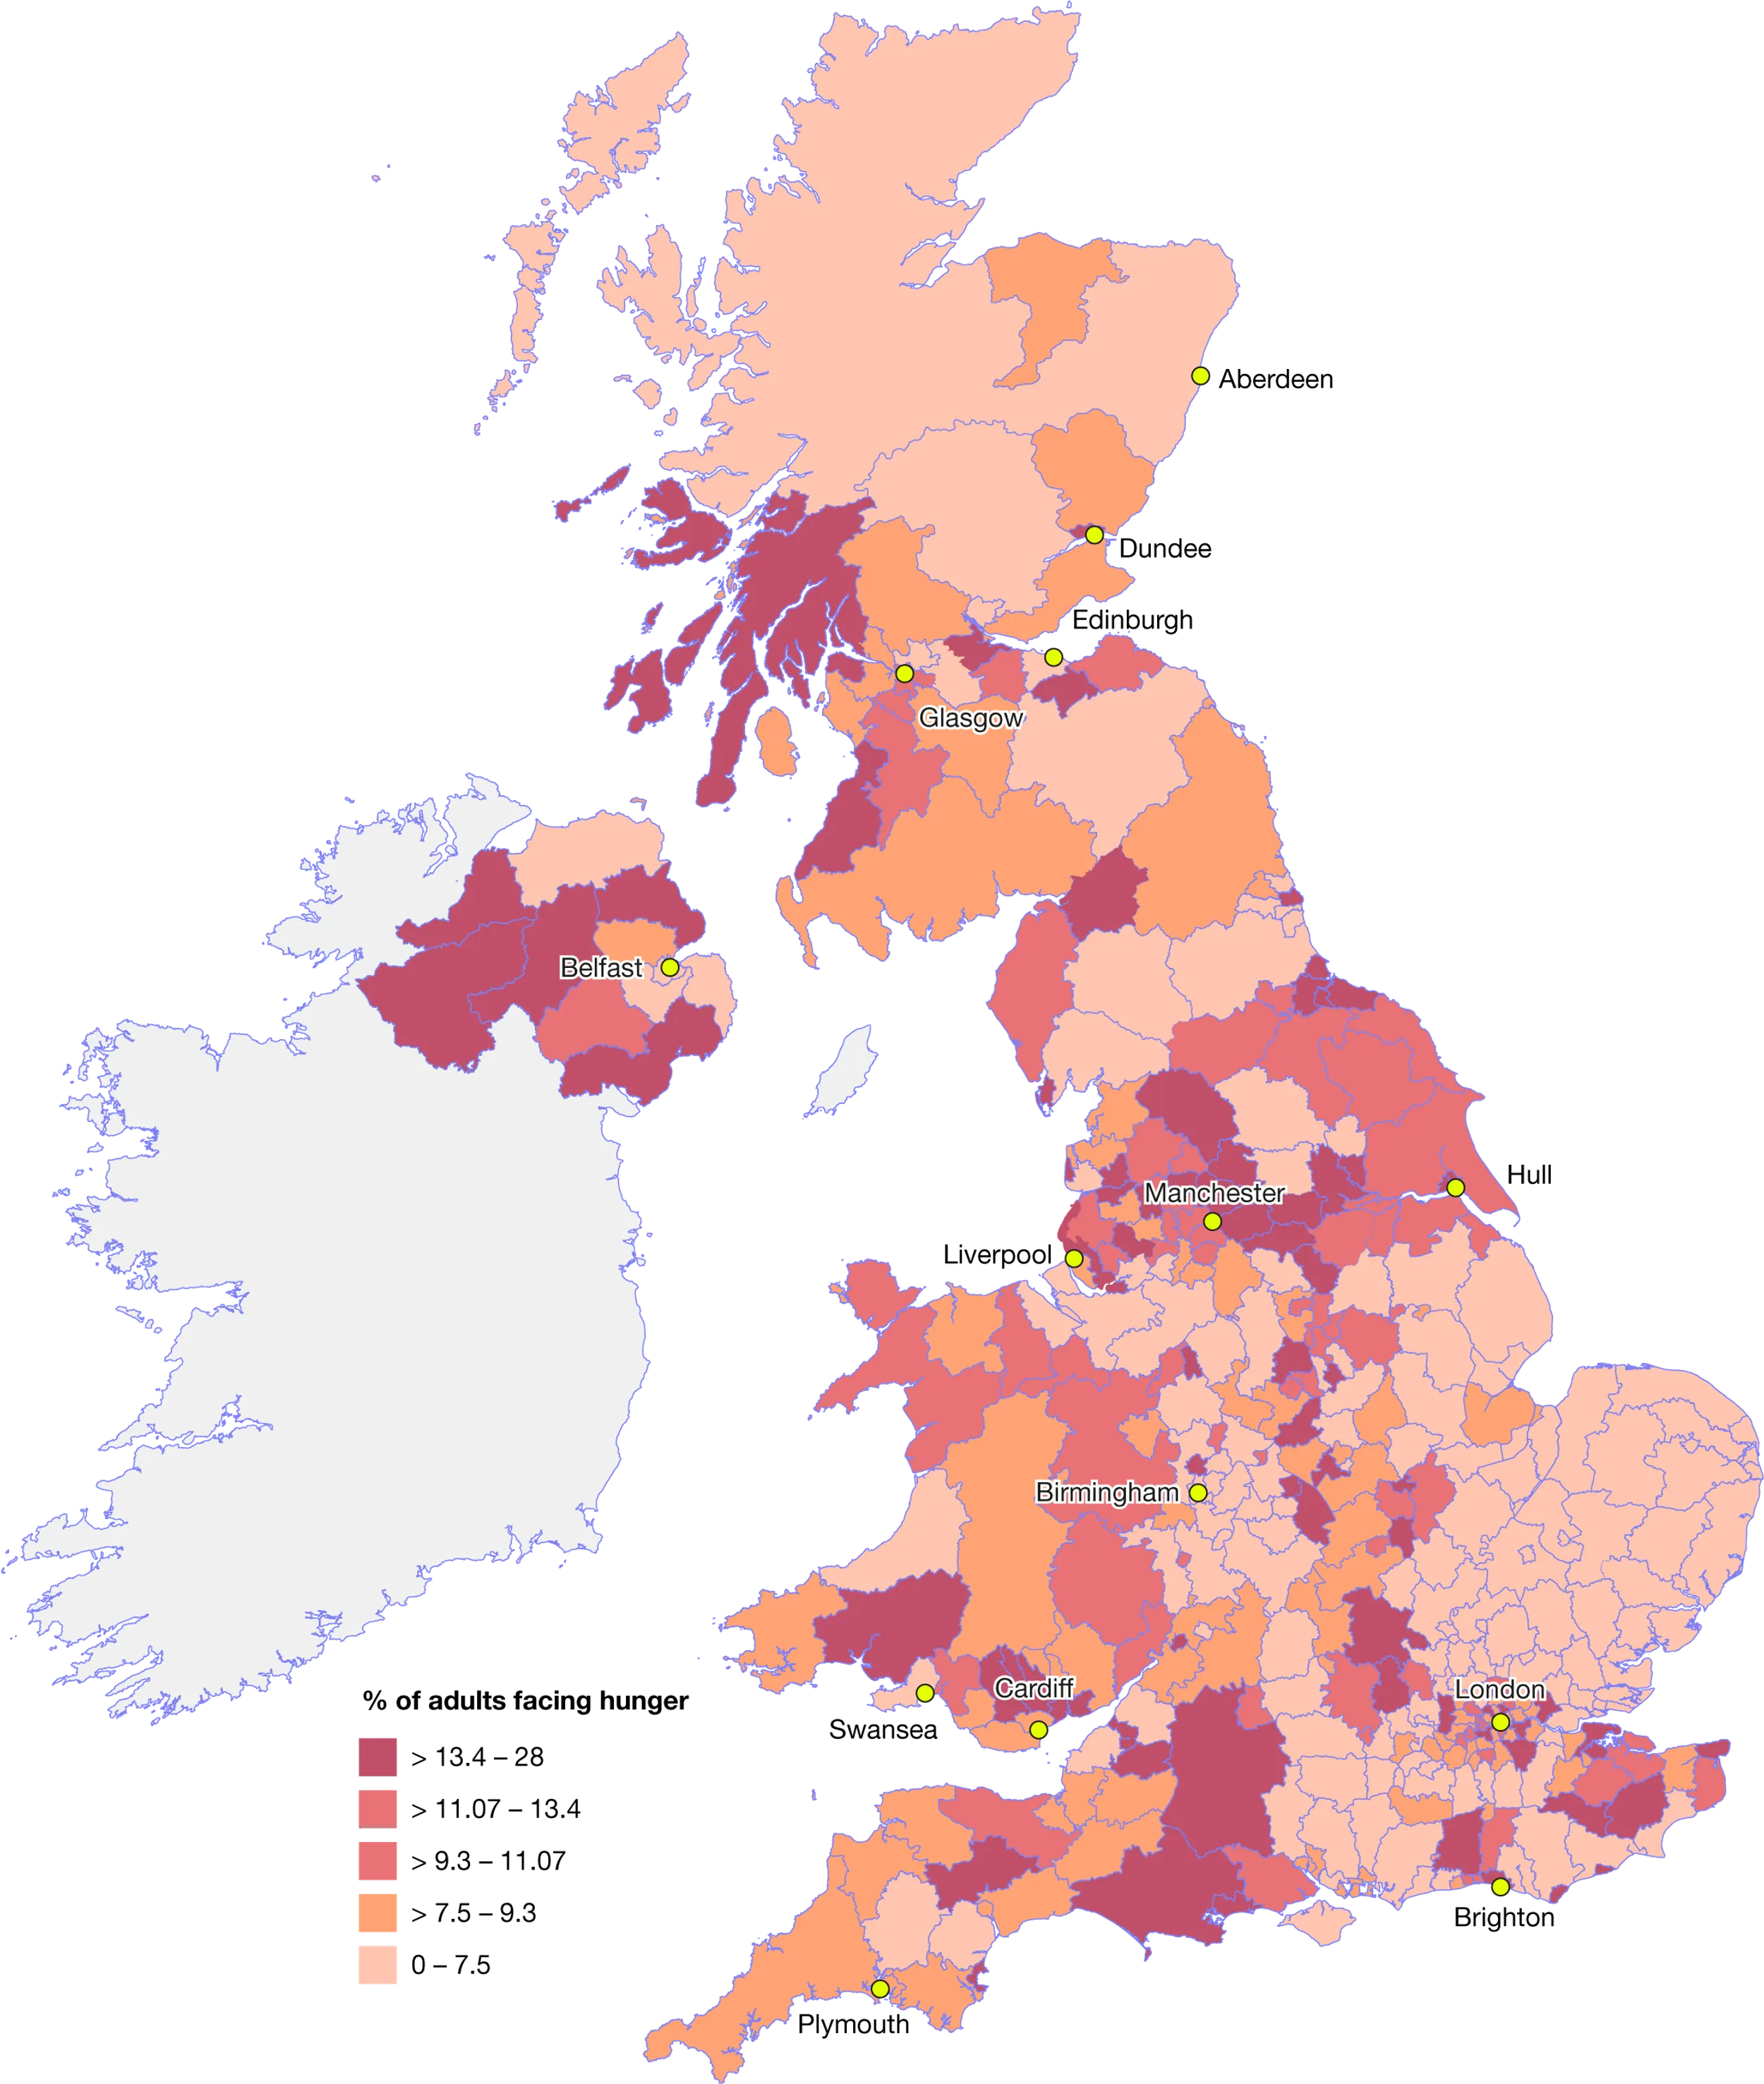
Food insecurity has doubled in the last year.
9.3 million adults are experiencing food insecurity in January 2023. This is the equivalent to 17.7% of households. Once again, there are marked regional differences, with higher levels of food insecurity observed in the North, Midlands, and Wales.
Taking into account the rise in heating costs, petrol and diesel prices, and mortgage rate hikes, vulnerable households are left with stark choices: heating or eating. As the maps illustrate, households in the North, Midlands, and Wales are particularly vulnerable to increases in the cost of living. These areas bear the brunt of rising prices.
Wage increases are not keeping pace with inflation.
According to the Centre for Cities' estimations, the North, Midlands, and Wales the largest gap between wage and benefit increases and inflation. For example, in Burnley, real wages (adjusted for inflation) have fallen by 7% compared to 3% in Milton Keynes. The report suggests that this leaves households in the North, Midlands, and Wales £340 worse off per year. For households at the bottom of the socioeconomic ladder, this situation is nothing short of disastrous.
Related News, Tips & Resources


Find exactly what you’re looking for.
- Popular Searches
- Biology
- Chemistry
- Geography
- A Level Media Studies
- Physics
- A Level Environmental Science
Newsletter
General
Work with us
Get in touch
- © 2026 Curriculum Press
- Terms & Conditions
- Privacy & Cookies
- Website MadeByShape